S is for
I swear I didn't plan this! I was going to do socks or something like that, but anyway, here we are! The graphs and raw data are images to give the best accessability for everyone, but for those that want (email me) I can supply the spreadsheet in Open Office or Excel format.
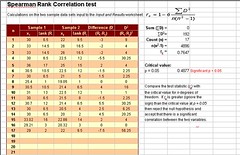
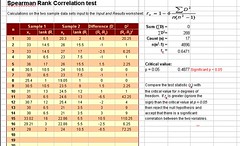
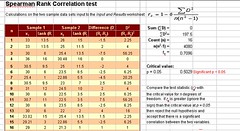
For the geeky among us, the stats test I used was the Spearmint Rhino Spearman Rank correlation coefficient. And just for Anne, I did the standard deviation (see the last photo).
I made the pics fairly small on the blog for those on dial-up or restricted bandwidth. Click on the pictures to be taken to Flickr where you will be able to see them full-sized (or larger in any case). If you use Firefox, simply right-click on the pictures and choose "Open in New Tab" from the menu; that way you will be able to keep this post open while you look at the pictures.
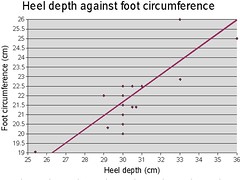
Note: the straight line is the linear regression for each graph.
Heel depth against ankle circumference: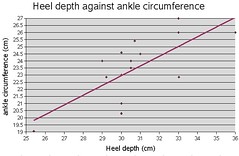
Heel depth against foot length: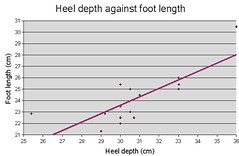
Raw data: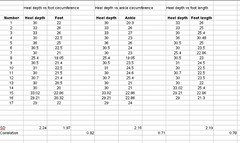
Thanks for indulging me, and I hope that you feel you're contribution was worthwhile.
S is also for Science. Here's a quick round up:
0: 2003 UB313 re-named Eris (the Greek goddess of discord!)
o: Oldest New World writing discovered (and they probably had better grammar than today's teenagers!)
Technorati tags: statistics; feet; science
7 Comments:
-
COOl =) Verrrrry Innnnterrrrestink
By JustApril, at Friday, 15 September, 2006
-
Cool graphs! I even regocnized that Spearman's coefficient, I think I had to do/was supposed to calculate it for my physics lab phase a year ago[totally useless though cause all our experiment results where wrong and we ended up explaining pages long why our results where differing so much from what we expected]
By javede, at Friday, 15 September, 2006
-
My first thought when I looked on Bloglines was that you are a scary woman! My second thought when looking at the post proper is that you are still a scary woman, but the graphs look quite interesting ... Oh dear, that probably makes me a geek, doesn't it? :)
By Mary-Lou, at Friday, 15 September, 2006
-
Lies, damn lies amd statistics!! I love being a data-ist!! I love your graphs and spreadsheets!! I am glad you are not a foot freak!! I do all the analysing and presenting of data from the testing at school because the Govt provides no help!! I am in maths heaven on that day!! I make prettily coloured graphs in Excel!!
By , at Saturday, 16 September, 2006
-
Standard deviation? My heart is pitter pattering... I might just have to dig out my old statistics books again for fun.
By
Ain't no doubt that I'm a geek. Nope.
Oh, and the sd was much lower than I expected! , at Saturday, 16 September, 2006
-
110010100111000100100010101010101010101000001101011101001010101011111101010101010000101101010101010101011101101010110101010101010010100101010101010101010111101000101101010101010101010100101010111101010001010101
By MrsDrWho, at Saturday, 16 September, 2006
-
I was completely lost by this post . . :-)
By WandaWoman, at Tuesday, 19 September, 2006
Post a Comment
<< Home
AmyP :: permalink


